Efemérides: Turning Celestial Mechanics into a Pattern Tool
 Jaylin Horta
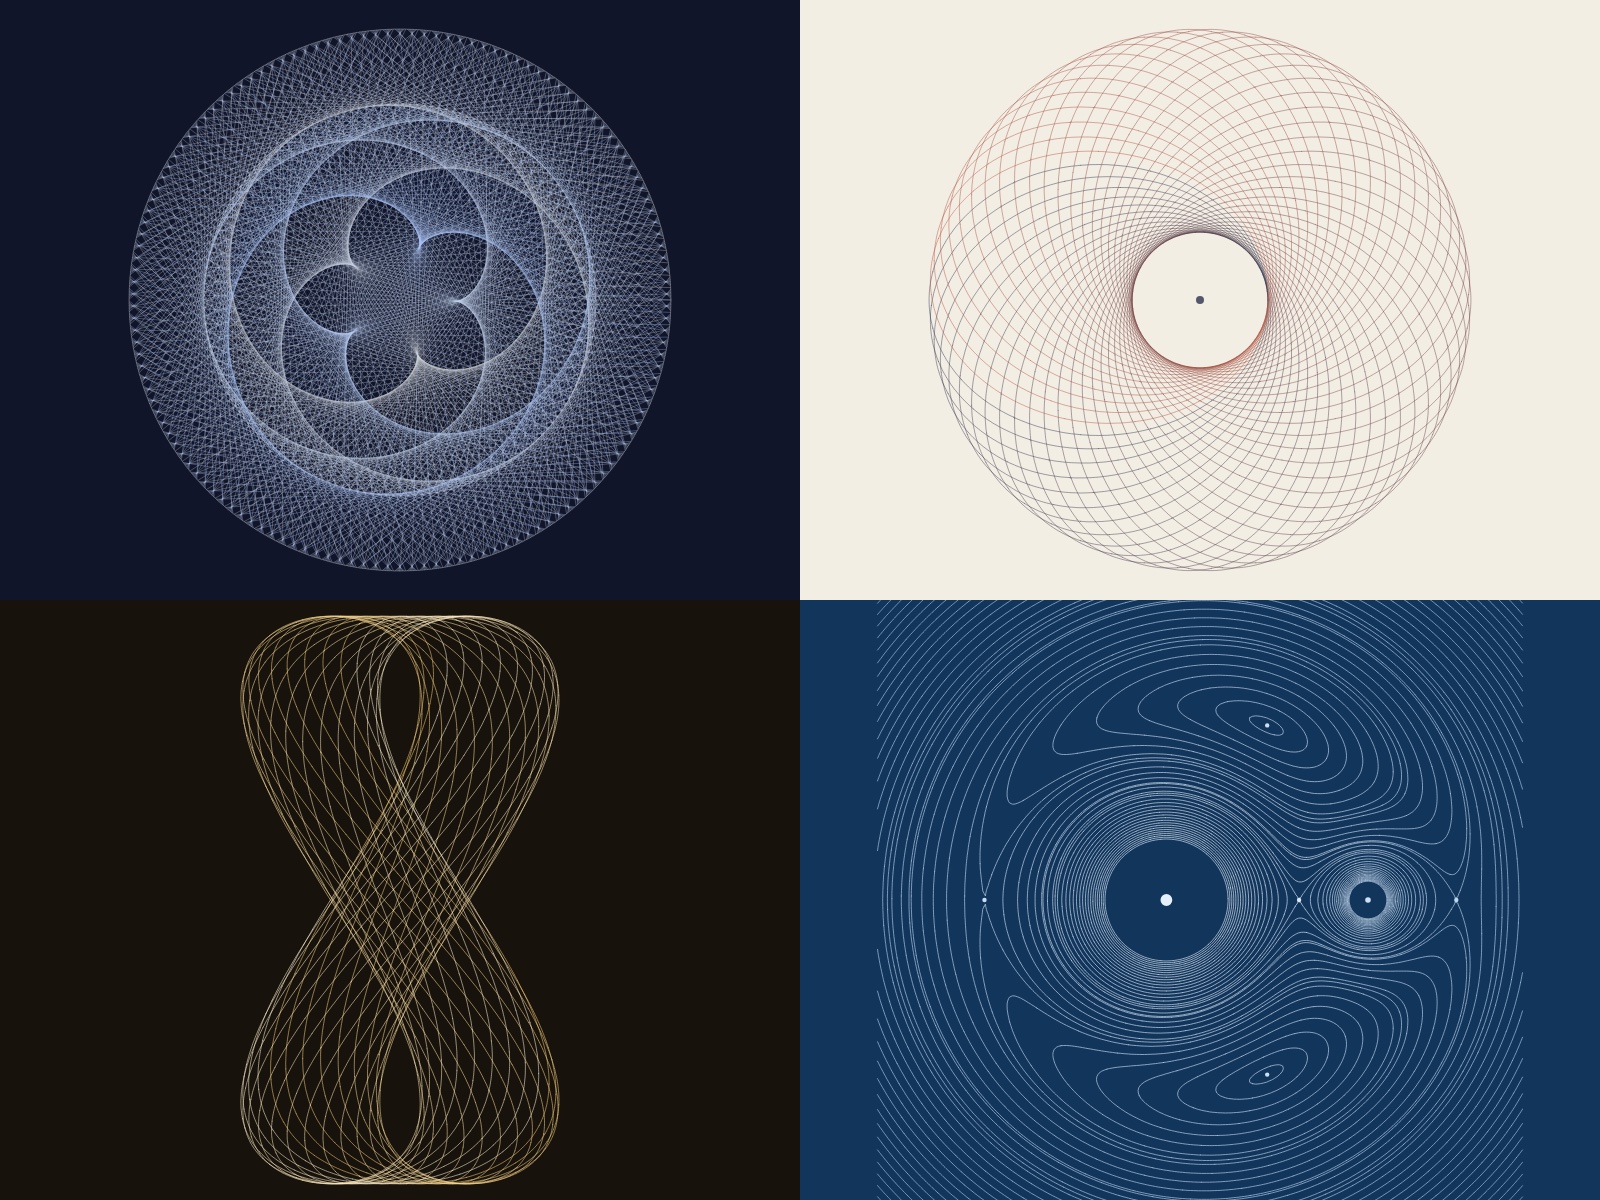
Some briefs ask for a logo. This one asked for a universe.
The Sociedad de Astronomía del Caribe (SAC) is preparing its second astronomy conference, and I’m building the brand system for it. SAC is a nonprofit of professionals, students and community members who share a passion for astronomy, and I’ve worked with them since redesigning their identity in 2022. This time I wanted the visual language to come from somewhere more honest than a stock photo of a star field.
So I started from a definition. Astronomical mathematics is the set of quantitative tools and models that let us measure, calculate and predict the motion, structure and evolution of celestial bodies. If that is what astronomers actually work with, then those equations should be the source of the shapes, too.
That idea became Efemérides, a pattern generator where every line on the canvas is the output of a real astronomical model. It began as an internal tool for the SAC conference. It’s now an open experiment anyone can use with their own brand colors.
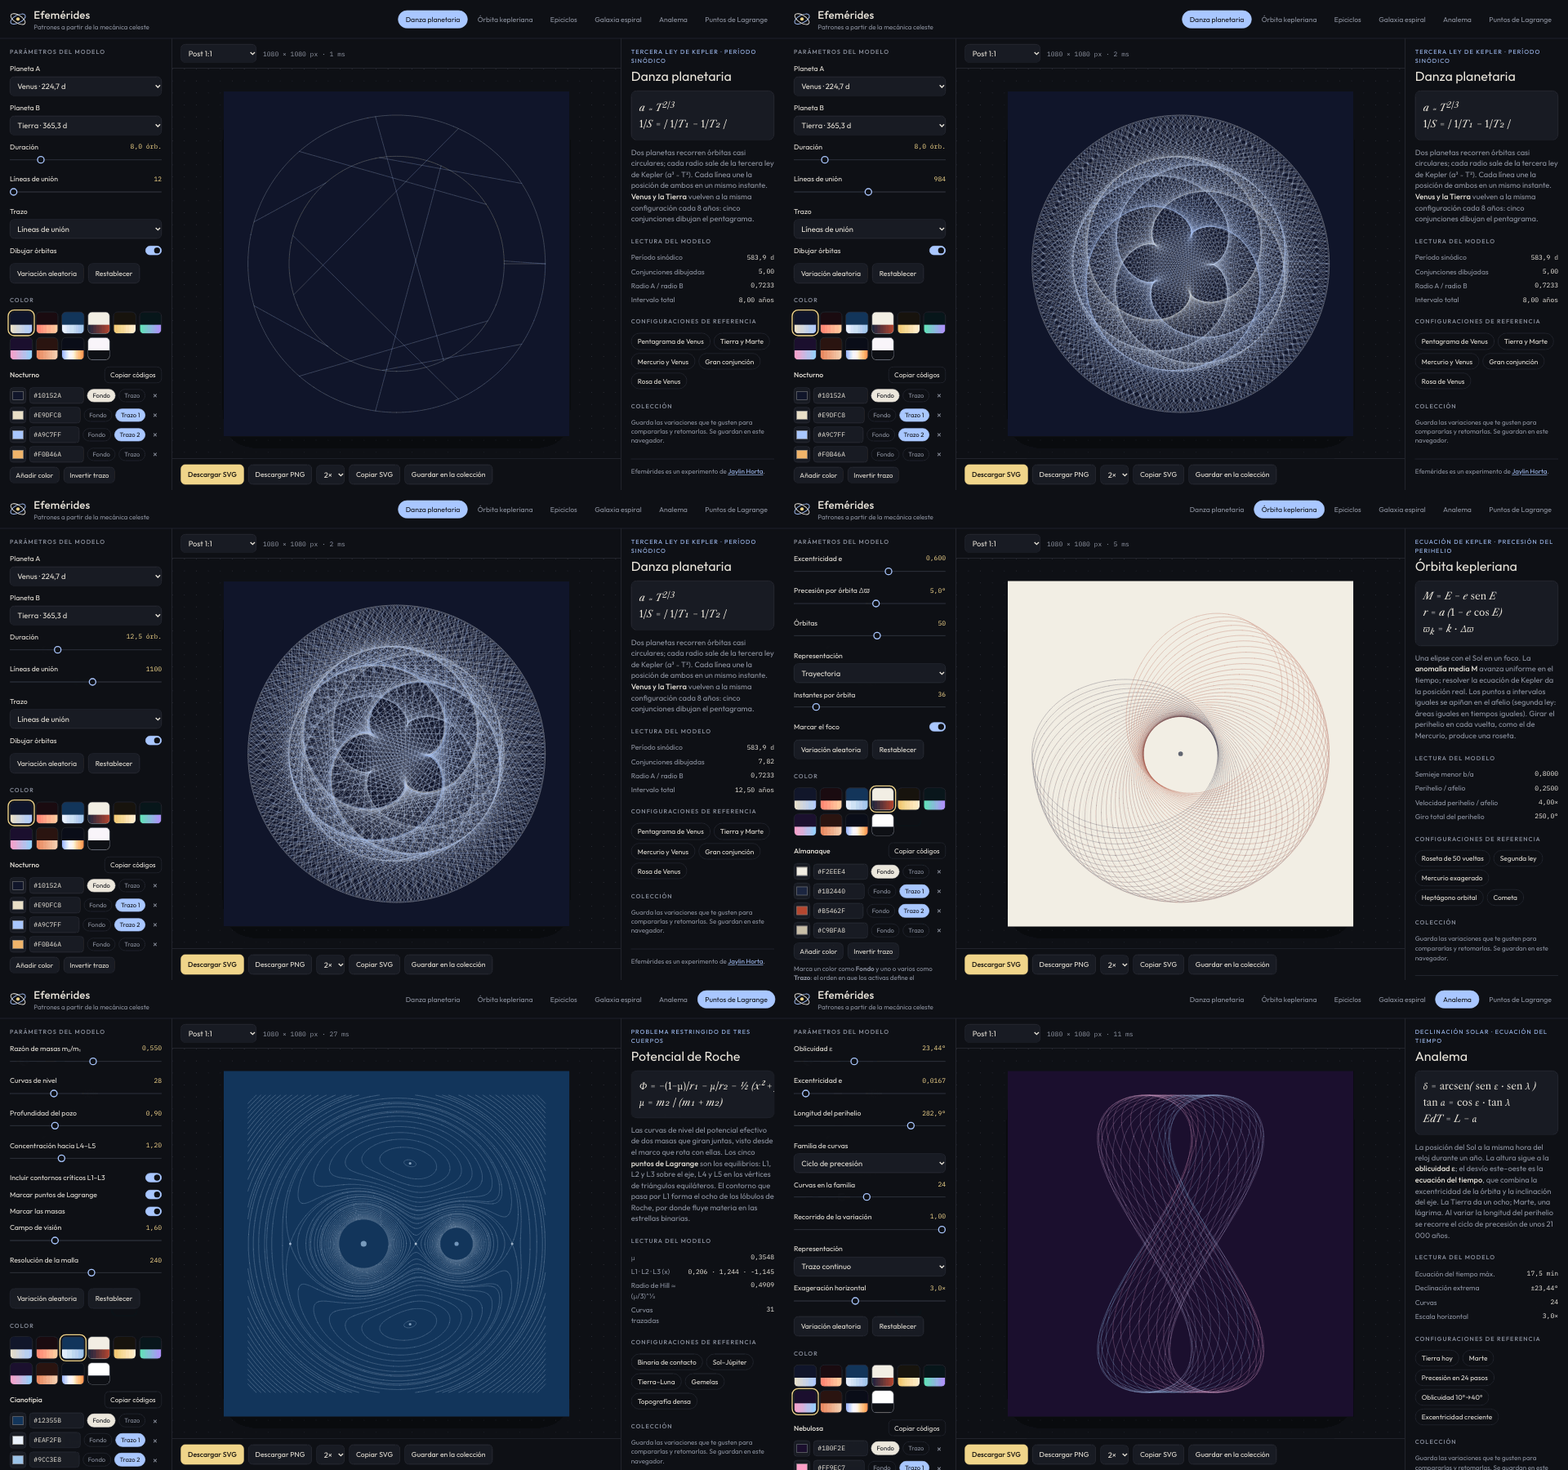
Six models, six visual families
Each model is a small simulation. You move the parameters, the physics recalculates, and the drawing follows.
- Planetary dance. Two planets orbit the Sun, their distances taken from Kepler’s third law (a³ ∝ T²). Each line connects both planets at the same instant. Venus and Earth return to the same configuration every eight years, and their five conjunctions trace a pentagram. Earth and Mars, or Jupiter and Saturn, draw entirely different roses.
- Keplerian orbit. An ellipse with the Sun at one focus, solved with Kepler’s equation, M = E − e sin E. Dots placed at equal time intervals bunch up far from the Sun, which is the second law made visible. Rotate the perihelion a little on every lap, as Mercury’s does, and the orbit becomes a rosette.
- Epicycles. The Ptolemaic model of circles riding on circles, which is also the idea behind Fourier series. With whole-number frequencies the curve closes, and the tool tells you its rotational symmetry before you count the petals.
- Spiral galaxy. Two takes on spiral arms: density waves, where stacked elliptical orbits twist with radius until arms appear, and the logarithmic spiral, controlled by its pitch angle (about 12° for the Milky Way).
- Analemma. The figure-eight the Sun traces in the sky when you photograph it at the same clock time all year. Change the axial tilt or the orbit’s eccentricity and the shape morphs. Mars gives a teardrop. Step the perihelion around the circle and you get a family of curves spanning the roughly 21,000-year precession cycle.
- Lagrange points. Contour lines of the effective gravitational potential of two bodies orbiting each other. The five equilibrium points appear on their own, and the contour through L1 draws the figure-eight of the Roche lobes, where material flows between binary stars.
Accuracy as a design principle
I made a rule early on: no fake astronomy. If a shape claims to be an analemma, it has to be one.
That’s why every model shows its equation, a short explanation and a panel of live readings. When the analemma is set to Earth today, the tool reports an equation of time that peaks at about 16 minutes, which is what the real Sun does. Switch to Mars and it climbs to about 51 minutes. For the Earth–Moon system, L1 lands at 0.837 of the distance between them. Those numbers are the check that the drawing is real, and for a science audience that matters. A conference attendee should be able to look at a poster and recognize the physics.
Each model also includes reference configurations, like Venus pentagram, Mercury, exaggerated or Sun–Jupiter. They teach the space before you start exploring it.
From client tool to open experiment
The first version was built entirely around SAC: its four official palettes, its typography test and the conference name over the canvas. It worked well for exploring the identity. But as I used it, I noticed the engine had nothing to do with one client. The math was general. Only the colors were SAC’s.
So I split the project in two. The SAC version stays private as a working tool for the conference. For the public version I removed every client color and reference and replaced the fixed palettes with something more useful: bring your own brand.
- Upload a logo or brand guide. The tool extracts the dominant colors from the image, using k-means clustering, then merges near-duplicate tones.
- Pick with the eyedropper. The uploaded image stays visible, and clicking anywhere on it adds that exact color.
- Paste or drop your codes. Hex,
rgb()andhsl()values are read from any text, including CSS variables, design tokens in JSON or an SVG file. - Assign roles. Mark one color as the background and one or more as the stroke. The order you activate them sets the gradient.
Every color is also editable with a picker or a hex field, and palettes can be saved for later.
Built for real deliverables
A brand system doesn’t live on one screen, so the output had to hold up at any size.
- Everything exports as SVG, so a pattern can go straight into Illustrator, Figma or InDesign and scale to a roll-up banner without losing a line. PNG export is there for quick social posts.
- The canvas comes in the formats a launch actually needs: square and 4:5 posts, stories, 16:9 screens, an ISO A poster and a vertical banner.
- A test-text overlay lets you check how a headline sits on a pattern before you leave the tool. It never ends up in the exported file.
- A small collection keeps your favorite variations side by side, so you can compare and return to them.
Under the hood
Efemérides is a single HTML file with no frameworks and no libraries. Each model is a pure function that returns polylines and points in unit coordinates; a shared renderer handles scale, rotation, symmetry, color and export. A few pieces were fun to solve:
- Kepler’s equation has no closed-form solution, so the tool solves it numerically with Newton’s method for every point.
- The Lagrange contours come from a marching-squares pass over a grid of potential values, with the segments stitched into continuous paths. The result is clean vector lines rather than thousands of loose fragments.
- Color extraction runs a k-means++ clustering on a downscaled copy of your image, weighted for how the eye perceives color differences.
Everything runs in the browser. Uploaded images and files never leave your device.
What’s next
For SAC, these patterns are becoming the backbone of the conference identity, across print and digital pieces. For everyone else, Efemérides is open in the Experimentarium. I’d love to see what the solar system draws in your colors.